2016年的小作文是“表格”题的主场,到目前已经考察了13次独立的表格题和一次表和线的混合,最近一次考是在10月8日,11月份没出现,所以预计12月份会有一次收尾。其实表格的火爆不难理解,接触过这种题型的烤鸭都知道,表格是我们最不爱写的一种数据类作文,信息零散,不容易发现规律和特征,语言容易零散。所以随着考试难度的增加,这种有难度或者说比较麻烦的题才会频繁地出现,打乱我们的阵脚。所以考试临近,让老师帮大家分析一下我们的“对手”,了解然后再战胜。
剑桥雅思10中提供了最新的表格满分范文,两个表格的数据,信息两非常大,这也是目前雅思教学中我所遇到的最“恶心”的表格图了。但是不用怕,万变不离其宗。
剑10Test2
You should spend about 20 minutes on this task.

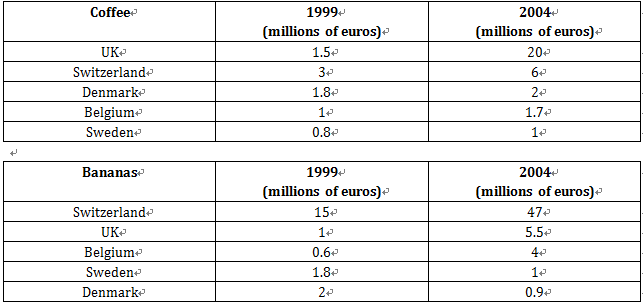
The table below give information about sales of Fairtrade*-labelled coffee and bananas in 1999 and 2004 in five European countries.
Summarise the information by selecting and reporting the main features, and make comparisons where relevant.
满分范文:
The two tables contain sales data for Fairtrade coffee and bananas in 1999 and 2004, in five nations of Europe.
(1)The first table shows low-level coffee sales increasing in all five countries, albeit to widely varying degrees. (2)In two places sales increased by the same small amount: 1.8-2million euros in Denmark, and 0.8-1 million in Sweden. (3)The increment was slightly larger in Belgium, from 1-1.7 million euros. (4)Meanwhile, in Switzerland sales doubled from 3-6 million euros. (5)Finally, in the UK there was an enormous increase, from 1.4-20 million euros.
(6)In the second table, it is Swizerland which stands out as buying far more Fairtrade bananas than the other four countries. (7)Swiss sales figures jumped from 15-47 million euros across these five years, while in the UK and Belgium sales only grew from 1-5.5 and from 0.6-4 million euros respectively. (8)Sweden and Denmark showed a different pattern with falls in banana sales from 1.8-1 and 2-0.9 million euros.
(9)Comparing the two tables, it is clear that in 1999 Fairtrade coffee sales ranged from 0.8-3 million euros in these five countries, while banana sales also mostly clustered between 0.6 and 2 million euros, with Swizerland the outlier at a huge 15 million euros. (10)By 2004, sales figures for both products had risen across the board, except for Sweden and Demark which recorded drops in banana sales.
表格题最难的部分就是通过分析数据归类,建立数据之间的联系。该文章总共4段,具体展开逻辑如下:
第一段:
改写题目。
第二段:
描述表格一:(1)coffee价格较低且变化幅度多样。(2)涨幅相同的两个国家。(3)涨幅稍
大的国家。(4)增长二倍的国家。(5)巨幅增长的国家。[按照涨幅从低到高的顺序描述]
第三段:
描述表格二:(6)拥有最大数据的国家。(7)数据增长的国家:大幅涨的国家+小幅涨的国家(8)数据下降的国家。[按照“最大,增长,下降”分类描述]
第四段:
对比两个表格:(9)1999年的数据主要特征:两个图数据波动范围+最大数据。(10)2004年的数据主要特征:增长+减少。
通过以上分析我们可以看出,表格图的看图逻辑是非常丰富的,可以按照“多少”“升降”“涨幅”“年份”等重要因素进行数据的整理和归类。所以我们应该花些时间在整理数据环节,如果有必要建议在试卷上简单标注分析思路。一旦思路确定下来,其实表格题还是非常容易处理的,常用词汇仍然没有超出我们日常积累范围。所以接下来老师重点带大家分析一些表格的数据,如果鸭鸭们有了思路,可以尝试用英文表达出来。
练习一:

整个表格没有提到“时间”维度,所以我们只需要按照“多少”“差距幅度”来处理,并且根据economics, law, commerce这三个学科来进行分段:
Economics:(1)概述:各项之间差距大;(2)两个最高(95%,90%),while两个最低(59%,60%),剩一个没特点的数据81%。
Law:(1)差距不大(2)多数在70%左右(70%,72%,76%),and 上下浮动差值10%左右(少则62%,多则80%)。
Commerce:(1)整体好评率都比较高。(2)前两个方面95%,tutor稍差一些但也有95%。(3)剩下的两项相对较低(86%,81%)但是也都比其他两个学科高。
数据分析完毕,现在开始规划段落,个人比较习惯“大到小”原则,所以先写commerce,再写law,最后写economics。烤鸭们可以试着写写看。
练习二:

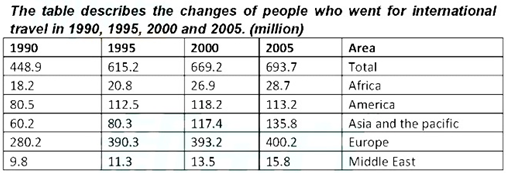
“时间”维度和“多少”维度都在这个表格中体现出来了,根据“多少”维度,我们先把数据非为一下几类:(1)Total总数(2)Europe最高(3)America,Asia and the pacific相似(4)Africa, Middle East较少。
根据“时间”维度,我们需要计算数字差距,来感受“升降”幅度。
(1) Total总数:1990~1995年间涨幅大,后面趋于稳定。
(2) Europe最高:也是在头5年涨幅最大,而后每5年只有小幅度的增长,但仍然是五个国家中最大值。
(3) America,Asia and the pacific相似:2000年之前,前者一直高于后者。并且两者的差距先增大了10 million 然后又缩小到几乎为0,甚至在最后的一年中后者超过了前者。
(4) Africa, Middle East较少:前者每个年份的数据差不多是后者的两倍,并且两个地区数据几乎都是每个时段增长2million。
通过以上的分析思路,不知道孩子们是否已经理清了处理表格题的思路。但是还是需要通过大量的练习来提高熟练程度才能在考试当中迅速做出争取的判断哦!加油!
Write at least 150 words.
作者介绍
陈思佳:吉林新东方国外部写作组教研负责人,雅思写作教龄3.5年。擅长分析解读官方材料、挖掘知识落地方法、诊断学生问题和提出解决办法。

版权声明:本文系新东方网独家稿件,版权为新东方网所有。转载请注明来源和作者,否则必将追究法律责任。
编辑推荐:
更多内容请关注新东方网雅思频道,也可扫码关注我们的微信公共账号或加QQ群168861834。

(编辑:秦洁)


