研读雅思范文及作文模板可以帮助检验自己的写作水平,并能很好地吸收和应用优秀范文里的优秀内容。更多内容请关注新东方网。
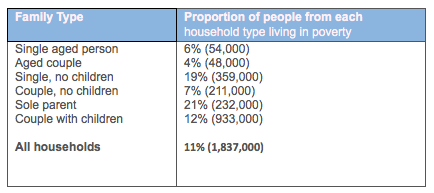
The table below shows the proportion of different categories of families living in poverty in Australia in 1999.
Write a report for a university lecturer describing the information shown below.
Summarise the information by selecting and reporting the main features, and make comparisons where relevant.
 Sample Answer:
The given table presents data regarding the poor families of different types in Australia for the year 1999. As is observed from the information, 11% of all households lived under poverty in 1999 in Australia and among them sole parents and single person with no child were the highest in percentage that lived under poverty.
According to the given data, more than 1.8 million families of Australia lived in poverty in 1999 that formed 11% of the total households. Among them, around 50 thousands poor family came from the Single aged person and aged couple who formed 6% and 4% of total of that family types. Sole parents and single person with no child formed the largest percentage of poor families and their percentage were consecutively 21% and 19% of their family types. Highest percentage of poor family was from sole parents and highest number of poor family was from couple with children type. Comparatively, couple with no child had less poverty percentage than the single with no children.
In conclusion, family type with aged people suffered less from poverty than the sole parents and single persons with no child.
最新热文推荐: 2019,考试分手!——留学考试备考规划