研读雅思范文及作文模板可以帮助检验自己的写作水平,并能很好地吸收和应用优秀范文里的优秀内容。更多内容请关注新东方网。
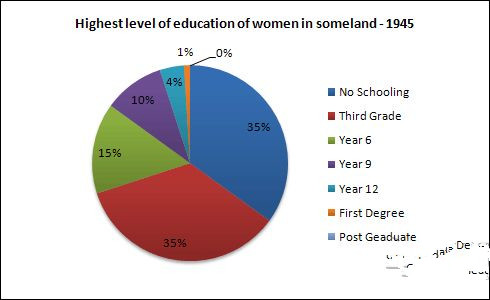
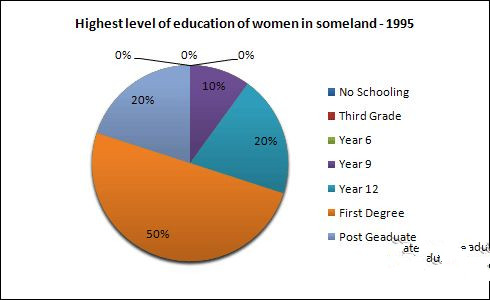
The pie chart below shows information on the highest level of education of women in someland in 1945 and 1995.
Write a report for a university lecturer describing the information in the two graphs below.
 Sample Answer:
The given pie charts compare the highest education level among women of someland in 50 years duration. As is observed from the given data, the women made remarkable progress in education over the 50 year’s period in someland.
Initially in 1945, more than one third women in someland did not have any schooling experience while another one third could manage education till third grade only. Less than 1% women in this year managed to get their graduation or post-graduation degree. This reflects the poor education level among the female of someland in 1945.
After 50 years, the education level among women in someland remarkably improved and more than 50% women finished their first degree while 20% of them completed their post graduates. Remaining women either finished their 12th grade education or studied till 9th grade. No women were left unattended to school and that’s a remarkable progress for women in education in somland.
In conclusion, education level among women improved significantly over the 50 years period in someland.
最新热文推荐: 2019,考试分手!——留学考试备考规划