研读雅思范文及作文模板可以帮助检验自己的写作水平,并能很好地吸收和应用优秀范文里的优秀内容。更多内容请关注新东方网。
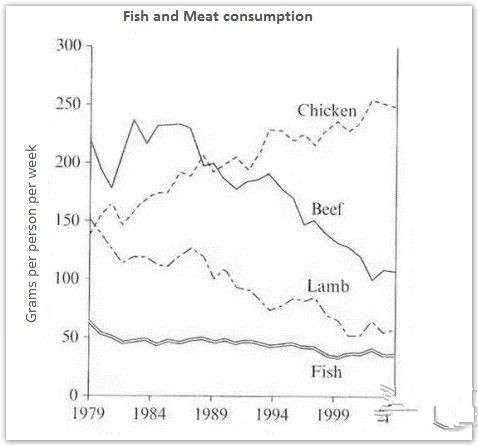
The graph below shows the consumption of fish and different kinds of meat in a European country between 1979 and 2004.
Summarise the information by selecting and reporting the main features and make comparisons where relevant.
 Sample Answer:
The given line graph compares the fish and meat consumptions by the people of a European country from 1979 to 2004.
As is presented in the graph, the consumption of chicken increased over the time while meats of different types were more preferred by people in the given European country than the fishes.
According to the graph, more than 200 grams of beef was consumed daily by each person initially in 1979. In this year, each person on an average ate 150 grams of chicken and lambs while the consumption was just over 50 grams in this year. Over time people preferred chicken and the consumption kept on increasing and reached to over 250 grams per day by each person. The consumption of beef, lamb decreased over time and finally in 2004 the average consumption of these two meat types decreased to around 100 grams per person in a day. The amount consumed for fish remained almost same throughout the years and slightly decreased over time.
In summary, people started consuming more chicken than beef and lamb and the fish consumption remained almost same.
最新热文推荐: 2019,考试分手!——留学考试备考规划