研读雅思范文及作文模板可以帮助检验自己的写作水平,并能很好地吸收和应用优秀范文里的优秀内容。更多内容请关注新东方网。
The graph below shows the differences in wheat exports over three different areas.
Write a report for a university lecturer describing the information shown below.
 Sample Answer:
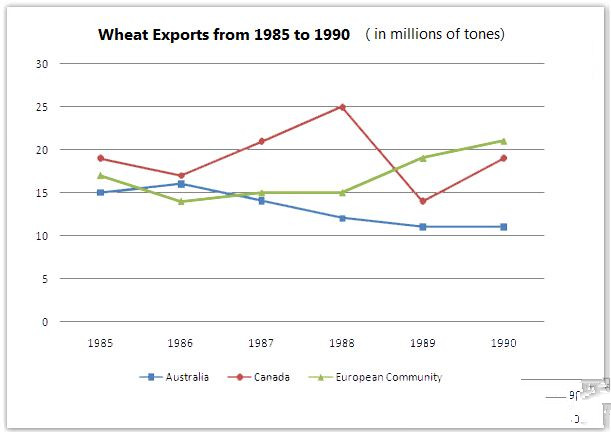
The given line graph compares the wheat exports over three different parts of the world namely Australia, Canada and European Community from 1985 to 1990. As is presented in the graph, the wheat export in Australia decreased over time while the export in Canada and European countries increased with some fluctuations.
According to the graph, around 15 to 20 million tons of wheat was exported to Australia, Canada and European community. This amount decreased slightly in 1986 reaching at around 15 million tons and from that point the export quantity in Australia kept on decreasing and reached just over 10 million tons in 1990. In the mean time, the amount increased sharply in Canada up until 1988 and then there was a quick decline and finally it reached to around 19 million tons in 1990. Finally the wheat export in European Community increased gradually over the years and reached to over 20 million tons in 1990.
最新热文推荐: 2019,考试分手!——留学考试备考规划