研读雅思范文及作文模板可以帮助检验自己的写作水平,并能很好地吸收和应用优秀范文里的优秀内容。更多内容请关注新东方网。
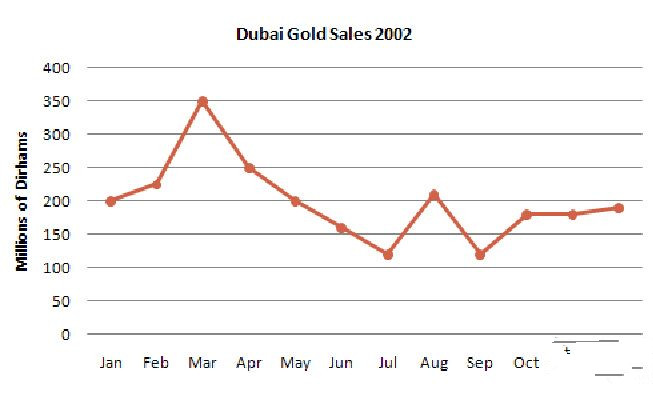
The line graph shows estimated sales of gold in Dubai for 12 months in 2002 in millions of Dirhams.
Write a report describing the information in the graph below.
 Sample Answer:
The given line graphs shows data on Gold sales in Dubai from January to December of the year 2002. As is presented on the illustration, the highest amounts of sales were done in March and lowest sales were in July and September.
As is presented in the line graph, initially in January, 2002 two hundred millions of Dirham Gold was sold in January and this amount keep increasing for the next two month and in March it reached to 350 million which is the largest amount throughout the whole year. After that the sales volume keeps declining steadily and reached to 110 million in July. With some fluctuation the sale amount reached to 200 million in August and finally in December it totaled about 200 million.
In summary, Mars was the best month for Dubai Gold sales in the year 2002 and throughout the year the sale volume fluctuated keeping an approximate average of 180 million of Dirham per month.
最新热文推荐: 2019,考试分手!——留学考试备考规划