研读雅思范文及作文模板可以帮助检验自己的写作水平,并能很好地吸收和应用优秀范文里的优秀内容。更多内容请关注新东方网。
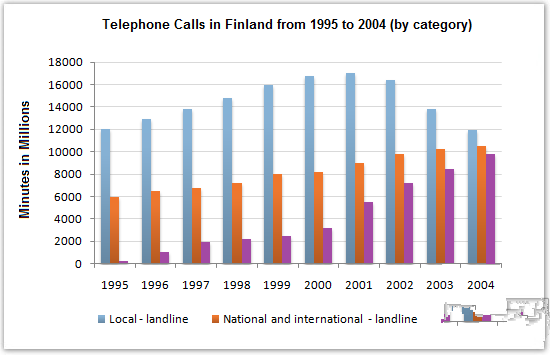
The chart below shows the total number of minutes (in millions) of telephone calls in Finland, divided into three categories, from 1995 – 2004.
Summarise the information by selecting and reporting the main features, and make comparisons where relevant.
Sample Answer:
The given bar graph shows data on the three types of calls made by Finnish citizens from 1995 to 2004. As is given on the graph, most Finish citizens made local landline calls while the mobile phone usages increased over the time.
Initially in 1995, Finnish people made 12000 million minutes of local-landline calls while the national & international calling time was half of that. Very few mobile calls were made in this year. But over time the mobile calling time increased steadily and reached to about 8000 million minutes in 2008. The local calling was the most popular way of calling throughout the period but after 2001, this way of calling kept decreasing with the popularity of mobile phones and national & international calling. Mobile phone calling increased more compared to the other two ways of calling and the trends shows that, over time the local landline usages declined while the other two ways of calling increased.
In summary, local landline calling in Finland is higher than mobile and national & international calling throughout the given period and total mobile phone calling time had increased more quickly than other two ways of calling.
最新热文推荐: 2019,考试分手!——留学考试备考规划