研读雅思范文及作文模板可以帮助检验自己的写作水平,并能很好地吸收和应用优秀范文里的优秀内容。更多内容请关注新东方网。
The chart below shows the percentage change in the share of international students among university graduates in different Canadian provinces between 2001 and 2006.
Summarise the information by selecting and reporting the main features, and
make comparisons where relevant.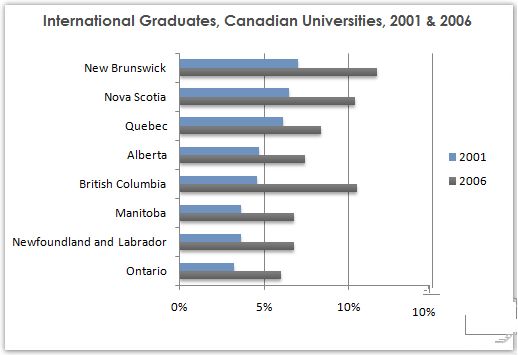
Sample Answer:
The given line graph shows data on the international students in eight different provinces of Canadian Universities between 2001 and 2006. As is presented in the graph, the percentage of international students among those provinces increased significantly.
According to the given data, New Brunswick had about 7% share of international students in 2001 which was the largest percentage. In this year, Nova Scotia and Quebec both had more than 5% share of international students. All other provinces listed in the graph had less than 5% share of those international students.
After 5 years in 2006, the percentages of international students in these provinces increased significantly and New Brunswick had the highest percentage of international students (about 12%) while Nova Scotia and British Columbia both had over 10% such students. The percentage of international students in all other provinces increased noticeably and these shares were between 6% - 8%.
In summary, more international students went to study in Canadian Universities in 2006 than 2001 and New Brunswick and British Columbia were two most favourite provinces for them in 2006.
最新热文推荐: 2019,考试分手!——留学考试备考规划