研读雅思范文及作文模板可以帮助检验自己的写作水平,并能很好地吸收和应用优秀范文里的优秀内容。更多内容请关注新东方网。
The chart below shows information about changes in average house prices in five different cities between 1990 and 2002 compared with the average house prices in 1989.
Summarize the information by selecting and reporting the main features, and
make comparisons where relevant.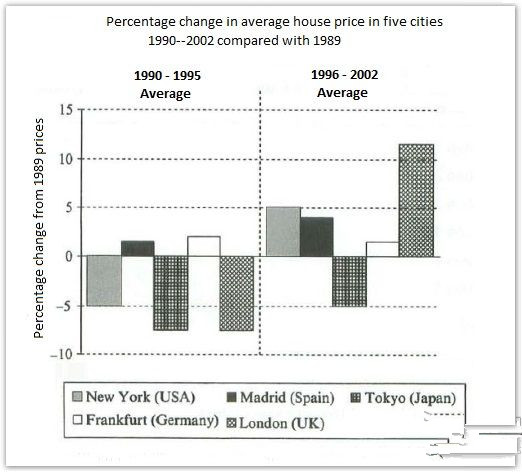
Sample Answer:
The given chart shows data on the changes on the prices of houses in two spans of periods, 1990 – 1995 and 1996 – 2002 compared to the prices of 1989. As is presented in the bar graph, prices of house got down in New York, Tokyo and London during 1990 to 1995 while the prices increased in London & New York during 1996 to 2002 compared to the prices of those houses in 1989.
According to the bar graph, the prices of houses in Madrid and Frankfurt increased by 2-3% during 1990 – 1995 while the prices decreased in New York, Tokyo and London by 5 to 8% in the same period compared to the prices of those houses in 1989.
Interestingly during the period 1996 to 2002, the prices in all cities except Frankfurt increased. Price increases of housing were 5% in New York, 4% Madrid, and over 11% in London compared to their prices in 1989. The only city where the prices decreased in 1996 to 2002 compared to the previous 5 years was Frankfurt.
最新热文推荐: 2019,考试分手!——留学考试备考规划