研读雅思范文及作文模板可以帮助检验自己的写作水平,并能很好地吸收和应用优秀范文里的优秀内容。更多内容请关注新东方网。
The charts below give information about USA marriage and divorce rates between 1970 and 2000, and the marital status of adult Americans in two of the years.
Summarise the information by selecting and reporting the main features, and
make comparisons where relevant.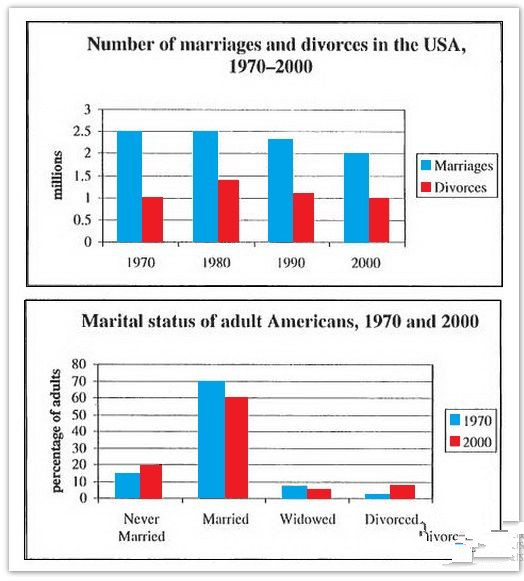
Sample Answer:
The given bar graphs show data on the marriage and divorce rate in the USA from 1970 to 2000 and also show the marital statuses of the US citizens in these two years.
According to the first bat graph, the marriage rate in 1970 & 1980 was 2.5 million and this rate decreased to 2 million in the year 2000. On the contrary, the divorce rate in the USA was 1 million in 1970 and this rate increased to almost 1.5 million in 1980 and after that it kept decreased to around 1 million again in the year 2000.
From the second graph, we can observe that in 1970 70% of adults were married while less than 15% never got married. The percenatges of widowed and divorced people were less than 10% in this year. After 30 years, in 2000, the percentages of married population decreased by 10% and the percentage of people who either never got married or got divorced increased.
最新热文推荐: 2019,考试分手!——留学考试备考规划